Trading for all.
Forex collateralized debt obligation (CDO) investments.
Based on how bank does FX market making, we know how to identify market manipulations and profit from them. Combined high performance FX trading with CDO concept.
Mars Fx International Ltd is a
Cayman Islands Monetary Authority regulated mutual fund
We are formed by a team of ex-banking professionals based in Kuala Lumpur.
Our trading strategy is based on how a bank does FX market making and financial product structuring, which leads us to develop winning investment programs.








Regulation
Cayman Islands Monetary Authority regulated mutual fund registration number 1959392 . Search “MARS FX INTERNATIONAL LTD”.
Background
With 20 years of research.
In real trading for 5 years as proof of theory.
Objective
Target to provide consistent monthly returns of more than 5% to 15%.
Structure
Based on Synthetic Collateralised debt obligation
to achieve predictability of returns.
Safety of Funds
All client money is segregated from business funds. Mars FX considers the security of customer funds to be the bedrock of the company’s values and no effort is spared in maintaining the security of customer funds by partnering with establish banks and prime brokers.
What is CDO?
A synthetic CDO is a financial product that has been around since 1987.
Objective is to obtain exposure to a cash flowing generating portfolio with diversified risks profile.
CDOs are called “collateralized” because the promised repayments of the underlying assets are the collateral
that gives the CDOs their value.
Banks pool and package cash-generating assets into CDOs.
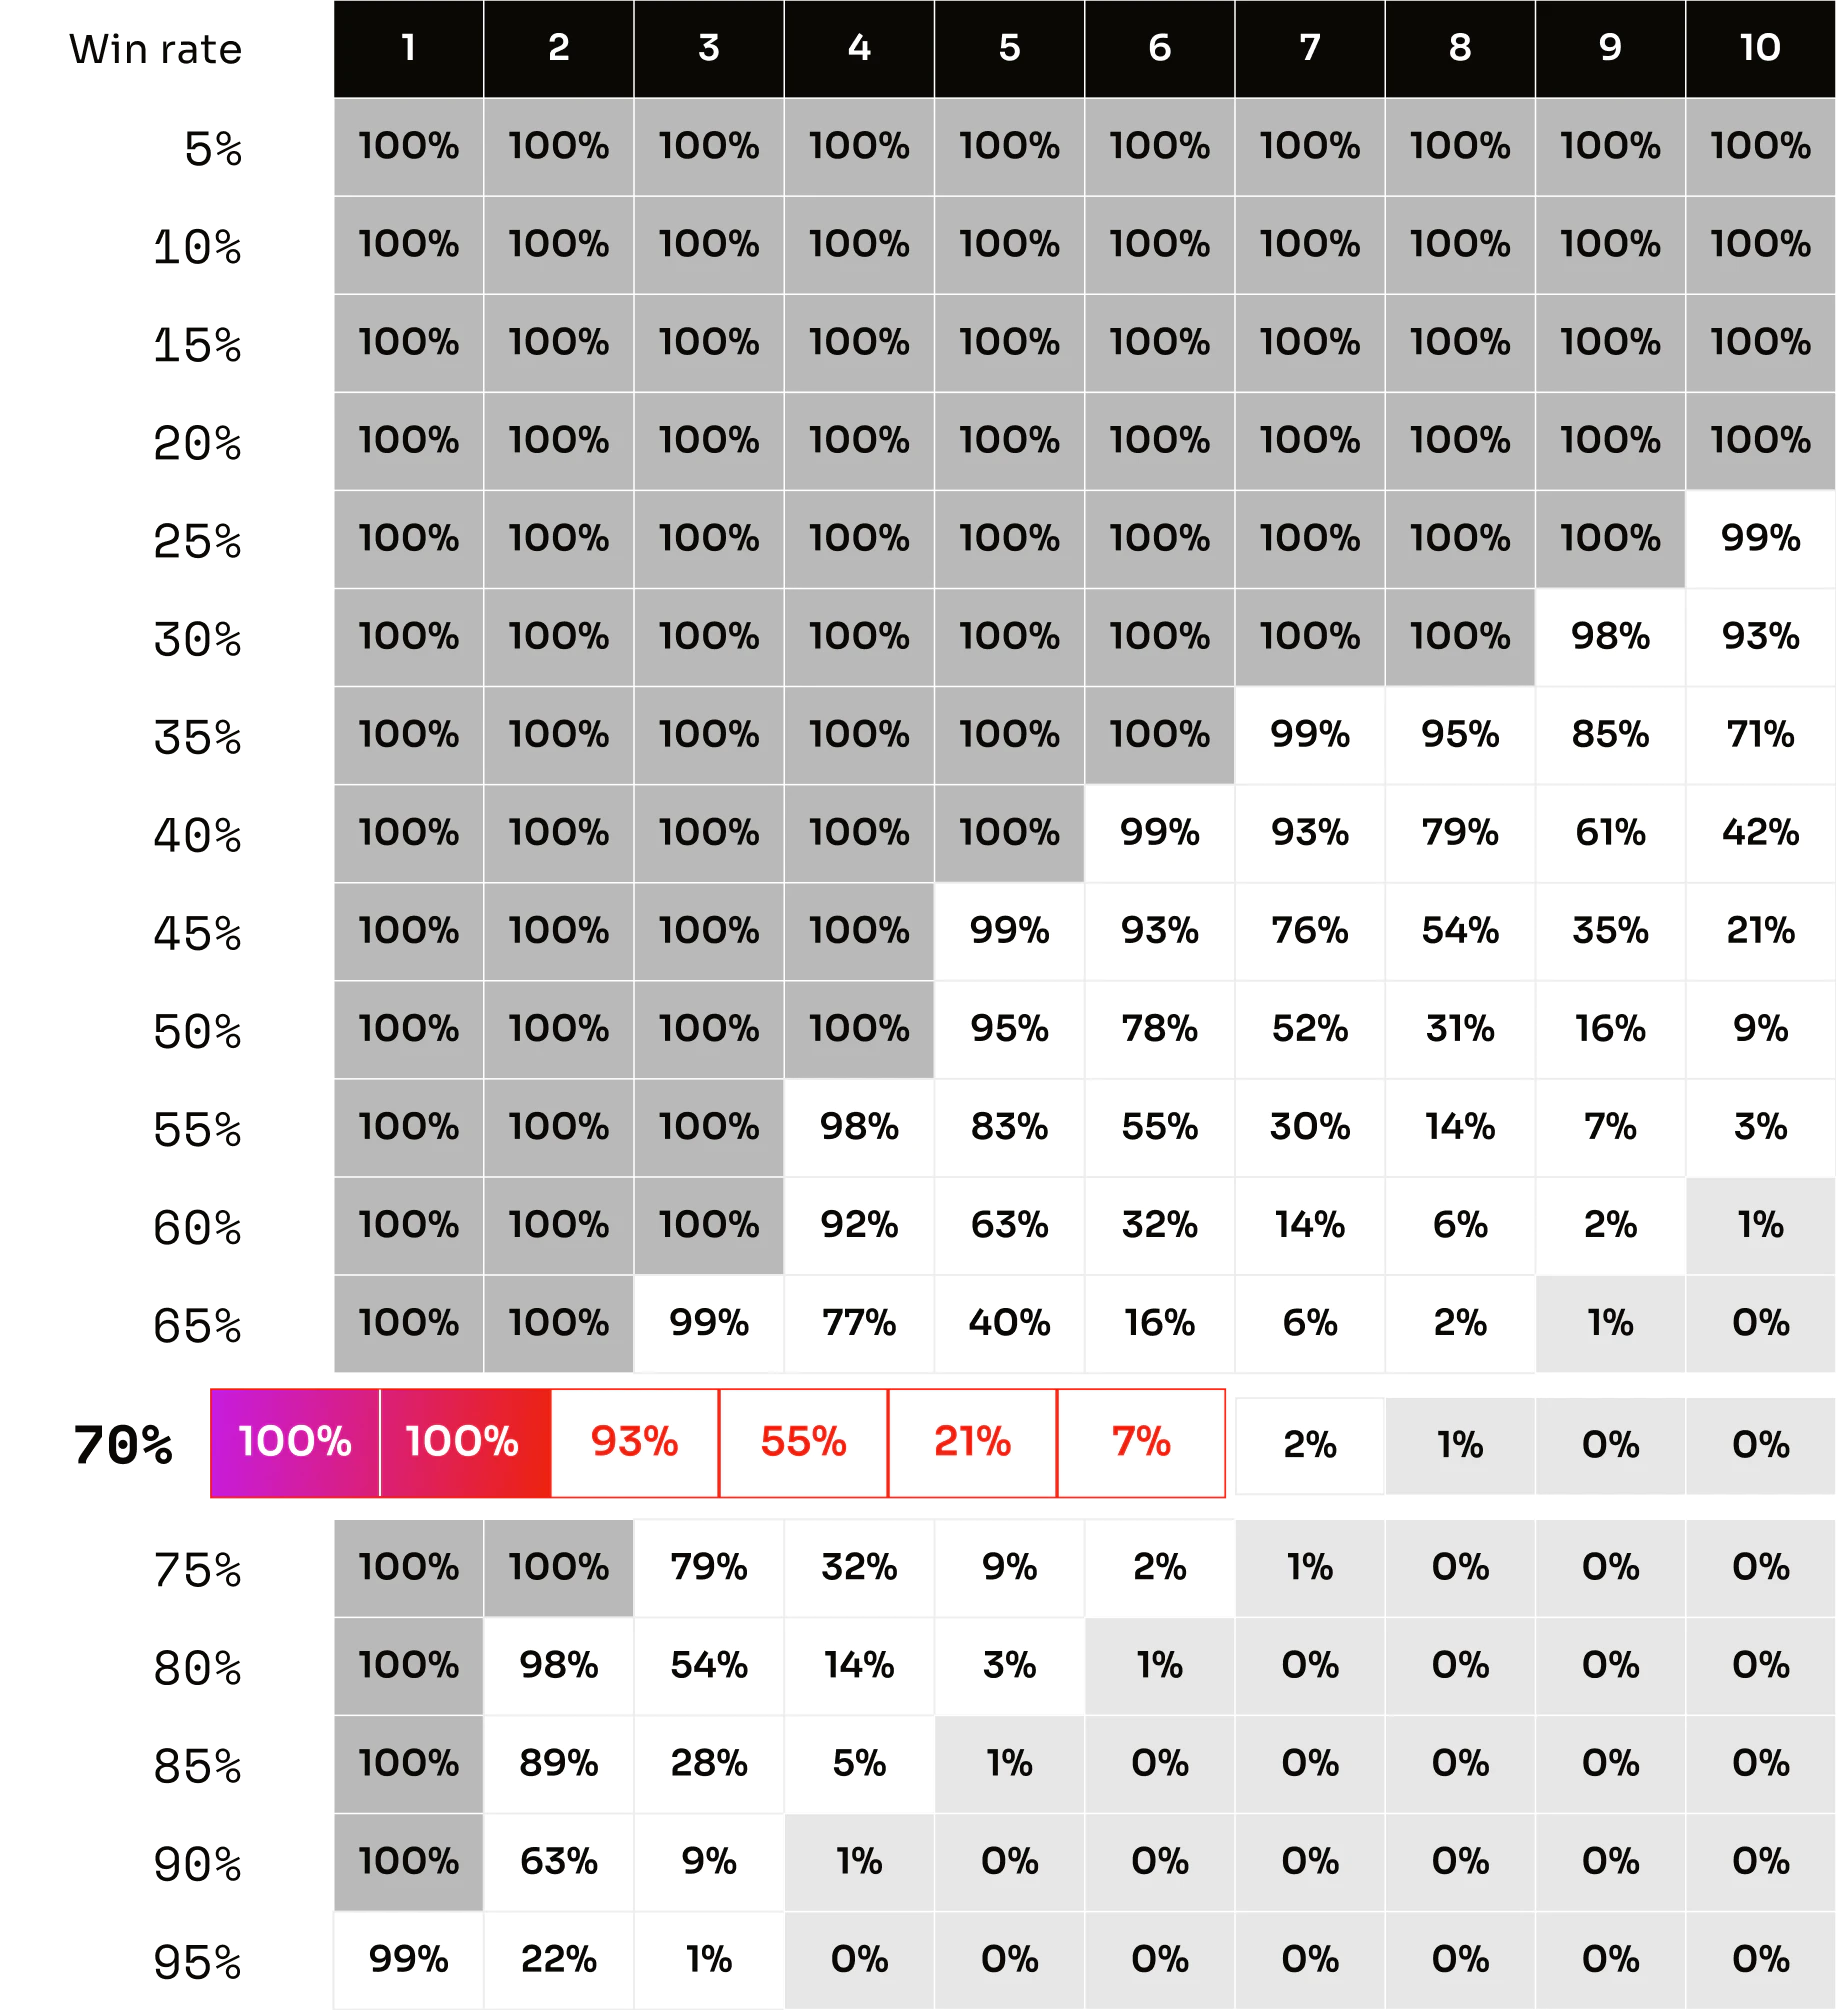
These are then sold to investors who wants higher dividends as compared to traditional bonds.Based on the concept of CDOs, Mars FX structured 5 uncorrelated cash flowing generating forex portfolio and combine them into one fund with 93% certainty of generating monthly dividends.
How it works?
Each Customer are automatically grouped into 5 different groups that will be managed by 5 trading desk (EUR, GBP, CHF, AUD, NZD) that will produce uncorrelated results.
Each group represent a cash generating asset in the CDO structure.
The groups are “collateralized” because of their commitment to produce cash flows for the fund but also their obligations to contribute to a
protection pool.
The performance of each group are independent
and uncorrelated.
The odds of each group experiencing losses is only 7%. Because the odds are so low, it is highly unlikely that any 2 groups will experience losses in any given month.
The certainty of monthly profits from the trading and distribution of risks among the groups is key to the success.
Frequently asked questions
Customers cannot choose which group they want to because we need to balance the amount of assets being managed in each group.
When a new customer registered for an account, the system will assign him/her to the group with the lowest AUM automatically. Deposits of the different groups are held in 5 master trading mt4 accounts maintained with our prime broker.When trades are placed in the master account, the trading “lots” will be distributed to individual customers via a Percentage Allocation system (PAMM).
We do not expect the performance of each group to be the same. Trading of each group is independent and uncorrelated. Some might perform better than the others in the short term. We can expect a difference of 2-3% in monthly performance.Short term differences do not represent long term performance of any group.
The objective of Mars FX Fund is to produce month on month positive cash flow with high predictability. Traditional trading will experience drawdowns where time will be required for capital to recover. This may take months even for high performing trading strategies. When the focus is on generating cash flow, the ability to produce consistent and predictable returns each month is preferred to catching trends and making big profits. This is why our trading strategy is short term with a high winning rate combined with martingale. (explained later)
With martingale, occurrence of short-term larger losses will happen.(7% chance of happening for Mars FX). Therefore, we need to diversify and randomly distribute occurrences of such larger losses across time effectively. By employing a CDO structure, we can disrupt the occurrence of such losses such that the odds of it happening to any groups in the short term is low. The odds of it happening to any 2 groups within the same month is even lower. We have a 93% chance of it not happening. Occurrence of the larger losses may not happen for some groups for years. The structure will allow the “lucky” groups to assist the “unlucky” groups with a protection feature. (explained later). This is truly innovative and time-tested at the same time.
No lock-in period.
Withdraw anytime.
Our Method
We employ a strategy called “Liquidity Hunting”
We analysed the orderbook of forex pairs to identify price levels indicating equilibrium in buyers and sellers.
Trades will enter when market imbalance are detected.
0.40% win
TP (0.0004 points)
0.40% loss
SL (0.0004 points)
2-5 mins
Average holding time
2 to 5
Trades Per Day
6 times
Employs Martingale (Max)
Why Use Martingale
Martingale ensures certainty
The concept of a CDO structure is to achieve high monthly cash flow with certainty. Non-martingale trading will produce prolonged drawdowns (time to recover) that may last for few months.
Here’s how we control the martingale risks:
Start will very small trade at 0.40% risks.
Limit the number of martingale to 6 times where maximum loss is -25.20%.
Based on “risk of ruin” mathematical odds, the chances of 6 consecutive losses is only 7%.
Effective distribution occurrence of such larger losses across time via a CDO structure.
We create the Protection Feature to aid the losses.
Frequently asked questions
The team had 20 years of research in FX trading. Our guys had worked in banks trading desks doing market making for many years and it is common knowledge within the circle that we all manipulate prices to hunt stops. By analyzing the orderbooks of different FX pairs and looking at price actions, we can predict when and where it will happen. With high accuracy, we can predict where price will go in the next 3-5 pips. In market making, liquidity has more impact as compared to price directions.
For example, a large institutional customer of the bank wants to sell 200 million Eurusd and the bank is obligated to buy at an agreed price. The bank will then want to sell this 200 million to the market in order to earn the spread. If liquidity is thin, the bank’s selling actions will cause prices to fall causing them to lose the spread and may even suffer capital losses. Thus, the banks will try to move prices upwards to levels where “buy stops/limits” are congregated so that they can sell their 200 million without much impact. As this move upwards is not supported by “real buyers” in the market, the sudden flooding of selling will cause a very short term “vacuum” of buyers to support price and price will fall. This vacuum is where we specialize.
We did 5 years of real trading to test our theory to achieve 70%-win rate probability. View records here: https://www.signalstart.com/analysis/thunderbot/39031
Yes you can stop trading anytime by requesting for a full withdrawal of your deposit.
Deposits of the different groups are held in 5 master trading mt4 accounts maintained with our prime broker.
When trades are placed in the master account, the trading “lots” will be distributed to individual customers via a Percentage Allocation system (PAMM). The lots allocated are proportional to the size of your account. You will not assume bigger risks.
Our maximum loss per first trade of the martingale is set at -0.40%.
It is USD40 for a customer with 10,000 capital.
Our stoploss is fixed at 0.0004 (4pips),
USD40/0.0004= 100,000 (1.0 lots)
Martingale is known to be risky because it will cause large losses for those who do not know how to control it. Their methodology is not supported by mathematical probability.
At Mars FX, here is how we control the martingale risks:
1) Start will very small trade at 0.4% risks
2) Limit the number of martingales to 6 times where maximum loss is -25.20%.
3) Based on “risk of ruin” mathematical odds, the chances of 6 consecutive losses is only 7%..
4) Effective distribution occurrence of such larger losses across time via a CDO structure.
5) There is a Protection Feature to help cover losses.
Worry-free.
There is protection for you.
Protection Event
Receive payouts to mitigate the risk of martingale
This concept is inspired by how banks bought “credit default swaps” as a form of insurance to manage their own risks.
What is a Protection Event?
A protection event is triggered when any of the groups experienced 6 consecutive losses where the maximum loss is calculated to be -25.20%.
Trading will stop automatically for the group.
The affected group will be able to receive “payout” of 25.20% from the protection pool to help them recover from the losses.
The other groups will not be affected and continue to contribute funds to the protection pool.
It is very likely that only one of the five groups will ever experience a protection event at any point in time given the low odds.
Frequently asked questions
After each winning trade, 50% of net profits from all the 5 groups of customers will be deducted into the protection pool.
For example:
1st trade: Loss of US 50 Accumulated loss: -US50
2rd trade: Loss of USD100 Accumulated loss: -US150
3rd trade: Loss of USD200 Accumulated loss: -US350
4th trade: Won USD400 Accumulated profits: +US400
Net profits: USD50
Contributions to protection pool: USD50 X 50% = USD25
Based on calculations, a protection event where one of the groups lost -25.20%, it will be approximately 6% of the whole fund’s asset under management (total of the 5 groups).
Thus, it is the objective of the fund to accumulated at least 6% reserve in this pool. It is expected that the reserve can be replenished within 2-3 months. Reserves in excess of the 6% mark may be allocated to trading so as to increase the speed of replenishment.
The fund may choose to limit acceptance of new deposits should the reserve in the protection pool falls below our preferred threshold.
Any reserves in the protection pool will be used as pay-out to the affected group upon an event.
The amount of pay-outs received by each affected customer will be determined by the proportion of their balance in their particular group.
For example:
1. The EUR group currently has USD 1,000,000 doing trading.
2. Customer A has USD 10,000 in his investment account.
3. The EUR group suffered 6 consecutive losses and the protection event was triggered.
4. The fund will retrieve USD 252,000 (25.20% x 1,000,000) from the protection pool and prepare to distribute it to affected customers.
5. After the 6 consecutive losses, the EUR group will now have USD 748,000 to do trading.
6. Customer A will now have USD 7480 in his investment account. This is equal to 1% (7480/748,000) of the total balance in his/her group.
7. Customer A will be able to receive USD 2835 of pay-outs from protection. This is equal to 28.35% of USD 10,000, the initial amount in his investment account before the loss.
8. Customer A will receive the USD 2520 pay-out within 2 working days to be deposited into his/her investment account. This is due to the time needed for the fund to transfer the protection pool reserves from our custodian bank to the margin account maintained with our prime broker.
9. In the event that customer A’s investment account is in the process of martingale, the pay-out will only be credited after a winning trade has occurred.
In a situation where the pool is not sufficient to cover the full -25.20% loss, future trading profits will assist customers in recovering their losses.
Pay-out from the protection pool is limited to each specific event only. Meaning after a pay-out had occurred, any future reserve in the pool will not be used to repay for previous events.
This concept is inspired by how banks bought “credit default swaps” as a form of insurance to manage their own risks. We combine this with the application of insurance logic, and we have something that is not only innovative but very applicable.
Mars FX is able to build a community of customers where the “lucky” groups will be able to assist the “unluckier” groups in recovering their losses.
In a way, it is similar to how insurance works. Majority of insurance paying customers will not need to submit a claim in their lifetime. The insurance premiums that they pay every month will be used to help those customers who had an unfortunate event and needs to receive a payout.
The fund will earn its fee from the protection pool reserve.
It is the objective of the fund to accumulate at least 6% of the fund’s total assets under management as reserve in the pool for pay-outs during a protection event. The fund will earn its fee from excess reserves above the 6% mark.
Protection Pool Reserve >6% fund earns 30% of excess
Protection Pool Reserve >10% fund earns 50% of excess
Protection Pool Reserve >13% fund earns 100% of excess
Real Performance
Mars Fx fund
Protection pool: 5.23%
MARS FX FUND
|
Year
|
Jan
|
Feb
|
Mar
|
Apr
|
May
|
Jun
|
Jul
|
Aug
|
Sep
|
Oct
|
Nov
|
Dec
|
YTD
|
|
No. of
Protection Events |
|---|---|---|---|---|---|---|---|---|---|---|---|---|---|---|---|
|
2022
|
|
|
|
|
|
8.58%
|
7.39%
|
8.89%
|
10.18%
|
8.82%
|
7.73%
|
7.79%
|
64.00%
|
|
1
|
|
2023
|
|
|
|
|
|
|
|
|
|
|
|
|
|
|
0
|
|
2024
|
|
|
|
|
|
|
|
|
|
|
|
|
|
|
0
|
|
2025
|
|
|
|
|
|
|
|
|
|
|
|
|
|
|
0
|
*VAMI – A value added monthly index (VAMI) tracks the monthly performance of a hypothetical $1,000 investment, assuming reinvestment, over a period of time.
Past performance is not indicative of future performance, and Mars FX does not guarantee any returns or favourable performance. Trading foreign currencies is a high-risk venture, and we advise that you be aware of potential risks before participating.
EUR GROUP MARS FX
|
Year
|
Jan
|
Feb
|
Mar
|
Apr
|
May
|
Jun
|
Jul
|
Aug
|
Sep
|
Oct
|
Nov
|
Dec
|
YTD
|
|
No. of
Protection Events |
|---|---|---|---|---|---|---|---|---|---|---|---|---|---|---|---|
|
2022
|
|
|
|
|
|
9.84%
|
7.72%
|
8.70%
|
9.62%
|
9.88%
|
12.42%
|
7.63%
|
74.16%
|
|
0
|
|
2023
|
|
|
|
|
|
|
|
|
|
|
|
|
|
|
0
|
|
2024
|
|
|
|
|
|
|
|
|
|
|
|
|
|
|
0
|
|
2025
|
|
|
|
|
|
|
|
|
|
|
|
|
|
|
0
|
*VAMI – A value added monthly index (VAMI) tracks the monthly performance of a hypothetical $1,000 investment, assuming reinvestment, over a period of time.
Past performance is not indicative of future performance, and Mars FX does not guarantee any returns or favourable performance. Trading foreign currencies is a high-risk venture, and we advise that you be aware of potential risks before participating.
GBP GROUP MARS FX
|
Year
|
Jan
|
Feb
|
Mar
|
Apr
|
May
|
Jun
|
Jul
|
Aug
|
Sep
|
Oct
|
Nov
|
Dec
|
YTD
|
|
No. of
Protection Events |
|---|---|---|---|---|---|---|---|---|---|---|---|---|---|---|---|
|
2022
|
|
|
|
|
|
10.05%
|
7.38%
|
6.50%
|
13.79%
|
9.64%
|
7.96%
|
9.94%
|
69.51%
|
|
0
|
|
2023
|
|
|
|
|
|
|
|
|
|
|
|
|
|
|
0
|
|
2024
|
|
|
|
|
|
|
|
|
|
|
|
|
|
|
0
|
|
2025
|
|
|
|
|
|
|
|
|
|
|
|
|
|
|
0
|
*VAMI – A value added monthly index (VAMI) tracks the monthly performance of a hypothetical $1,000 investment, assuming reinvestment, over a period of time.
Past performance is not indicative of future performance, and Mars FX does not guarantee any returns or favourable performance. Trading foreign currencies is a high-risk venture, and we advise that you be aware of potential risks before participating.
CHF GROUP MARS FX
|
Year
|
Jan
|
Feb
|
Mar
|
Apr
|
May
|
Jun
|
Jul
|
Aug
|
Sep
|
Oct
|
Nov
|
Dec
|
YTD
|
|
No. of
Protection Events |
|---|---|---|---|---|---|---|---|---|---|---|---|---|---|---|---|
|
2022
|
|
|
|
|
|
5.22%
|
5.88%
|
11.98%
|
7.59%
|
7.72%
|
7.49%
|
7.52%
|
55.41%
|
|
0
|
|
2023
|
|
|
|
|
|
|
|
|
|
|
|
|
|
|
0
|
|
2024
|
|
|
|
|
|
|
|
|
|
|
|
|
|
|
0
|
|
2025
|
|
|
|
|
|
|
|
|
|
|
|
|
|
|
0
|
*VAMI – A value added monthly index (VAMI) tracks the monthly performance of a hypothetical $1,000 investment, assuming reinvestment, over a period of time.
Past performance is not indicative of future performance, and Mars FX does not guarantee any returns or favourable performance. Trading foreign currencies is a high-risk venture, and we advise that you be aware of potential risks before participating.
AUD GROUP MARS FX
|
Year
|
Jan
|
Feb
|
Mar
|
Apr
|
May
|
Jun
|
Jul
|
Aug
|
Sep
|
Oct
|
Nov
|
Dec
|
YTD
|
|
No. of
Protection Events |
|---|---|---|---|---|---|---|---|---|---|---|---|---|---|---|---|
|
2022
|
|
|
|
|
|
9.27%
|
8.52%
|
7.22%
|
10.12%
|
8.79%
|
9.47%
|
7.03%
|
67.01%
|
|
0
|
|
2023
|
|
|
|
|
|
|
|
|
|
|
|
|
|
|
0
|
|
2024
|
|
|
|
|
|
|
|
|
|
|
|
|
|
|
0
|
|
2025
|
|
|
|
|
|
|
|
|
|
|
|
|
|
|
0
|
*VAMI – A value added monthly index (VAMI) tracks the monthly performance of a hypothetical $1,000 investment, assuming reinvestment, over a period of time.
Past performance is not indicative of future performance, and Mars FX does not guarantee any returns or favourable performance. Trading foreign currencies is a high-risk venture, and we advise that you be aware of potential risks before participating.
NZD GROUP MARS FX
|
Year
|
Jan
|
Feb
|
Mar
|
Apr
|
May
|
Jun
|
Jul
|
Aug
|
Sep
|
Oct
|
Nov
|
Dec
|
YTD
|
|
No. of
Protection Events |
|---|---|---|---|---|---|---|---|---|---|---|---|---|---|---|---|
|
2022
|
|
|
|
|
|
8.54%
|
7.39%
|
10.24%
|
9.79%
|
7.81%
|
1.21%
|
6.71%
|
53.81%
|
|
1
|
|
2023
|
|
|
|
|
|
|
|
|
|
|
|
|
|
|
0
|
|
2024
|
|
|
|
|
|
|
|
|
|
|
|
|
|
|
0
|
|
2025
|
|
|
|
|
|
|
|
|
|
|
|
|
|
|
0
|
*VAMI – A value added monthly index (VAMI) tracks the monthly performance of a hypothetical $1,000 investment, assuming reinvestment, over a period of time.
Past performance is not indicative of future performance, and Mars FX does not guarantee any returns or favourable performance. Trading foreign currencies is a high-risk venture, and we advise that you be aware of potential risks before participating.
Frequently asked questions
Yes you can. Customers can either do full withdrawals of all capital or partial withdrawals of profits.
Full withdrawals:
Upon request of full withdrawal, trading will stop automatically.
It is important to note that trading will stop even though it is in the process of martingale for the previous few trades.
Partial Withdrawals:
For partial withdrawals of profits, trading will continue as normal. However, a reduction in customer’s capital will mean smaller trading lots will be allocated to the account for the next trade.
Partial withdrawals will only be processed after a winning trade had been made. This is because partial withdrawals made during the process of martingale will affect its ability to recover from previous losses.
1) USDT
2) Telegraphic Transfers
3) Visa/master:
It is important to note that the fund can only place deposits into the investment accounts after
a winning trade had occurred in any trading group. It can be done within 24-48 hours on average. This is because the trading group could be in the process of martingale and allowing new deposits to join in between will result in higher initial risks.
We ensures certainty.
93% to be exact.
It’s easy to start
Start trading with Mars Fx in 3 easy steps
Get Started for free
Track performance via the customer account.
It works automatically for you 24/5.
Withdraw profits anytime you prefer.
Join us and be a part of our growing community

